

One number decides whether the car wash on the corner lives or dies: 834 washes a month. Below that line, every month it opens it loses money. Above it, every car that rolls in carries profit. A feasibility study is the discipline of finding that line before you sign the lease — and this article computes the entire model, line by line, for a small car wash: startup costs, monthly operating costs, revenue, break-even in units and in currency, payback period, and three-year net profit, followed by a blank worksheet you can fill with your own numbers.
Every car-wash figure in this model is a clearly labeled illustrative assumption chosen to demonstrate the method. The method itself is not invented: the break-even formula is the one published on the U.S. Small Business Administration's official break-even calculator page, the structure follows the official feasibility study outline from Iowa State University's Extension service, and a fully verified real-world example — from the Food and Agriculture Organization of the United Nations — closes the article so you can see the same arithmetic on documented numbers.
The Method Before the Numbers: What a Feasibility Study Must Answer
A feasibility study answers one question: should this project exist? Iowa State University's official outline structures the answer in seven parts — description of the project, market feasibility, technical considerations, financial projections, organizational structure, conclusions, and next steps — and its guidance is direct about what the financial part must contain: estimate the sales needed to break even, run best-case, expected-case, and worst-case scenarios, and compare your results against industry averages.
The order matters, and it is the reverse of what most founders do. Most people start with the equipment they want to buy; a feasibility study starts with the sales the business must achieve daily to survive, and only then asks whether the market can plausibly deliver them.
Why model a car wash of all things? Because it is one of the most widely studied small-business sectors on earth. The International Carwash Association's industry data counts 17,584 staffed conveyor car washes with employees in the United States in the 2020 economic census, and its 2020 study estimates roughly 17,500 conveyor locations, 29,000 automatic in-bay washes, and 16,250 self-service sites across the country, with about 69,000 locations in Europe and 1,950 in Australia. The market runs to about 15 billion US dollars in North America, 5 billion euros in Europe, and 1.5 billion Australian dollars in Australia, employs more than 220,000 people, and builds more than 500 new locations a year. The share of US drivers using professional car washes climbed from about 48 percent in 1994 to roughly 80 percent — a demand tailwind most corner businesses never enjoy.

Image: International Carwash Association
Step 1: Startup Costs — What You Spend Before the First Car
A feasibility model begins with the money that leaves your pocket before a single customer arrives. Here is the illustrative startup budget for a small two-bay hand wash:
| Startup item | Illustrative cost (USD) |
|---|---|
| Washing equipment (pressure washers, foam unit, vacuums) | 14,000 |
| Water recycling and filtration unit | 3,500 |
| Signage and site dressing | 1,500 |
| Rent deposit plus first month (2 × 1,500) | 3,000 |
| Licenses and permits | 800 |
| Hand tools, hoses, opening stock of consumables | 1,200 |
| Launch marketing (map listings, flyers, opening promo) | 1,000 |
| Total startup investment | 25,000 |
Two habits matter more than the individual numbers. First, every line must be a real quote, not a guess — the model above is illustrative precisely because your supplier quotes will replace these figures. Second, include the boring lines: deposits, permits, and opening consumables are the costs founders forget, and they are the reason real openings overrun paper budgets. Iowa State's outline calls this the technical-consideration step: the plant, the site, and the capacity you are buying.
Step 2: Monthly Operating Costs — What You Pay Even at Zero Cars
Fixed costs are the bills that arrive whether the yard is full or empty. The illustrative monthly base for the same wash:
| Monthly fixed item | Illustrative cost (USD) |
|---|---|
| Land rent | 1,500 |
| Two workers at 550 each | 1,100 |
| Water and electricity base charge | 500 |
| Detergents and consumables restock | 600 |
| Equipment maintenance | 200 |
| Insurance and miscellaneous | 100 |
| Total fixed costs per month | 4,000 |
Notice a distinction that decides the whole model: the consumables restock above is the fixed baseline, but each individual wash also burns soap, water, and power per car. That per-unit cost belongs to the next step, not here. Keep the two categories separate — mixing fixed and variable costs is the most common arithmetic error in homemade feasibility studies, and it produces break-even points that look safe and are not.
One more real-world line belongs in your version: taxes. If you launch where value-added tax applies — and several Gulf states have changed their VAT frameworks recently, a shift we cover in our piece on the UAE VAT changes of October — your registered price and your filing calendar affect operating costs from month one.
Step 3: The Revenue Forecast — Cars, Price, and Days
Revenue in a service business is three honest numbers multiplied:
Monthly revenue = cars per day × price per wash × open days per month
The illustrative assumptions for our model: a single exterior hand wash priced at 7 dollars, a 30-day month, and — critically — three demand scenarios instead of one hopeful guess, exactly as Iowa State's official outline instructs:
| Demand scenario | Cars per day | Washes per month | Monthly revenue (USD) |
|---|---|---|---|
| Conservative | 30 | 900 | 6,300 |
| Expected | 40 | 1,200 | 8,400 |
| Optimistic | 50 | 1,500 | 10,500 |
Where do the cars-per-day figures come from in a real study? Counting, not hoping: sit at the candidate corner during peak hours across a full week, count passing traffic, apply a conversion assumption, and check it against the nearest competing wash's queue. The market-feasibility part of Iowa State's outline exists precisely to discipline this number. A revenue forecast with no counting method behind it is a wish list with a spreadsheet skin.
One variable cost remains before profit can exist. Each wash consumes water, detergent, electricity, and cloth: an illustrative 2.20 dollars per car. Subtract it from the price and you get the number the entire next section turns on — the contribution margin:
Contribution per wash = 7.00 − 2.20 = 4.80 dollars
Every wash contributes 4.80 dollars toward paying the 4,000-dollar fixed base. How many washes does that take? That is the break-even point.
Step 4: The Break-Even Point — in Units and in Currency
The U.S. Small Business Administration publishes the official formula on its break-even calculator page:
Break-even units = fixed costs ÷ (price per unit − variable cost per unit)
Plug in the model's numbers:
4,000 ÷ (7.00 − 2.20) = 4,000 ÷ 4.80 = 833.3 → 834 washes per month
You cannot wash a third of a car, so round up: 834 washes a month, about 28 cars a day every day. In currency, the same line is reached at 834 × 7 = 5,838 dollars of monthly revenue. Cross-check it with the margin method — fixed costs ÷ contribution margin ratio, where the ratio is 4.80 ÷ 7.00 = 0.686 — and you get 4,000 ÷ 0.686 ≈ 5,830, with the small difference coming only from rounding the unit count up. The two routes to the same answer are the model's built-in audit.
Read the scenarios against that line now. The conservative case (900 washes) clears break-even by just 66 washes a month — a margin of roughly two cars a day. The expected case (1,200) clears it by 366. That is what a feasibility study is for: not to predict the future, but to show how much room the project has before the future hurts it.
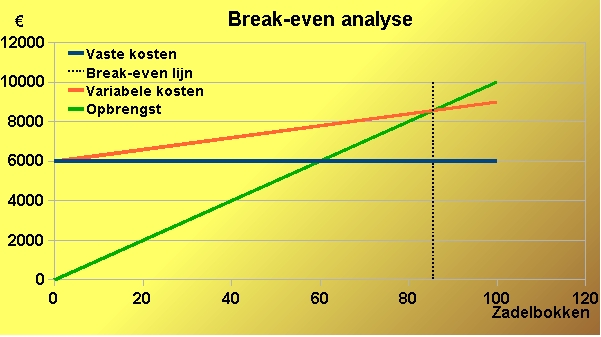
Image: Wikimedia Commons (public domain)
On the chart, the horizontal line is your 4,000 dollars of fixed costs, the gently rising line adds 2.20 dollars per wash, and the steeper line is revenue at 7 dollars a wash. Where revenue crosses total cost — at 834 units — the business stops losing money. Left of the crossing, the gap is your monthly loss; right of it, your monthly profit. For a clear walk-through of this chart and the contribution logic behind it, the British education service tutor2u publishes a solid short explainer on break-even and contribution.
Step 5: Payback Period, Three-Year Profit, and Sensitivity
Break-even says whether a month is safe. Payback says when the founder gets their 25,000 dollars back. In the expected scenario, monthly profit is 1,200 washes × 4.80 − 4,000 = 1,760 dollars, so steady-state payback is 25,000 ÷ 1,760 ≈ 14 months. Real launches ramp slowly, so the model's three-year table applies a first-year ramp to 30 cars a day, reaching the expected 40 in year two and 45 in year three:
| Line | Year 1 (30/day) | Year 2 (40/day) | Year 3 (45/day) |
|---|---|---|---|
| Washes per month | 900 | 1,200 | 1,350 |
| Contribution (washes × 4.80) | 4,320 | 5,760 | 6,480 |
| Fixed costs | 4,000 | 4,000 | 4,000 |
| Monthly net profit | 320 | 1,760 | 2,480 |
| Annual net profit (USD) | 3,840 | 21,120 | 29,760 |
Three-year cumulative net profit: 54,720 dollars. With the year-one ramp, cumulative profit passes the original 25,000-dollar investment during month 24 — the honest answer to "when do I get my money back," as opposed to the flattering 14-month steady-state figure. A feasibility study that quotes only the flattering number is selling, not studying.
Now run the sensitivity check across scenarios, as Iowa State's outline requires:
| Scenario | Cars/day | Monthly net profit (USD) | Startup payback |
|---|---|---|---|
| Conservative | 30 | 320 | About 78 months — a warning, not a plan |
| Expected | 40 | 1,760 | About 24 months with the ramp |
| Optimistic | 50 | 3,200 | Under 8 months |
The conservative row is the study's real output. A project that only survives in its expected scenario is not feasible; it is hopeful. If your honest conservative case shows 78-month payback, the correct next step is not a better pitch — it is a cheaper rent, a higher price, or a different corner.
Two practical notes before the reference model. When money starts moving, keep it separated: a dedicated business account with clean fees saves hours at tax time, and our review of the Wise business account walks through what to check. And if computing break-even and running the three-scenario sensitivity is the step you would rather hand to a professional, Truescho's feasibility study service has the study prepared by an accountant-consultant: a preliminary study at €99 — about 10 pages covering one year, delivered in 5 days — or a detailed study at €229, about 30 pages for 3 years including a market study and a three-scenario sensitivity analysis, delivered in 10 days, with editable Excel tables. No one can guarantee profit, and any consultant who does is selling you something else.
A Fully Verified Reference Model: The FAO Example
The car-wash figures above are illustrative by design. Here is the same arithmetic on real, documented numbers from the Food and Agriculture Organization of the United Nations' feasibility study chapter — a small food-processing operation packing a horticultural product:
| Line | FAO documented figure |
|---|---|
| Variable cost per pack | 0.270 dollars (= 15,380 ÷ 57,600 packs per year) |
| Selling price per pack | 0.555 dollars |
| Contribution per pack | 0.285 dollars |
| Annual fixed costs | 7,262 dollars |
| Break-even point | 7,262 ÷ 0.285 = 25,481 packs per year |
| Capacity utilization at break-even | 44.2 percent |
| Annual income | 31,968 dollars (36 kg/day × 3.70 dollars × 240 days) |
| Annual gross profit | 9,126 dollars |
| Total startup investment | 4,488.50 dollars, of which the owner's own capital covered 2,500 |
Run the method on this table and you will notice the familiar skeleton: unit economics first, fixed base second, break-even third, verdict last — exactly the flow you followed with the car wash. That is the point of a reference model: the numbers change with every business, the arithmetic never does. Note also the 44.2 percent figure — expressing break-even as a share of capacity tells you how much of the machine you must sell before profit starts, and it works for a packing line exactly as 834-of-what-share works for a wash bay.
Your Blank Feasibility Worksheet
Copy this table, replace the empty cells with your own quoted figures, and recompute using the four formulas above: contribution (price − variable cost), break-even units (fixed ÷ contribution), break-even value (units × price), and payback (startup ÷ monthly net at your expected scenario).
| Line item | Your figure |
|---|---|
| Equipment | |
| Site deposit and advance rent | |
| Licenses and permits | |
| Tools and opening consumables | |
| Launch marketing | |
| Other startup lines | |
| Total startup investment | |
| Monthly rent | |
| Staff wages | |
| Utilities base charge | |
| Consumables restock (fixed baseline) | |
| Maintenance | |
| Insurance and miscellaneous | |
| Total fixed costs per month | |
| Price per unit | |
| Variable cost per unit | |
| Contribution per unit | |
| Break-even units per month | |
| Break-even monthly revenue | |
| Expected units per month | |
| Monthly net profit (expected) | |
| Payback period | |
| Three-year cumulative net profit |
Feasibility Study vs Business Plan
Founders mix these two documents up constantly, and the confusion is expensive: they answer different questions, they are written at different moments, and a great business plan can never rescue an infeasible idea. A feasibility study proves the idea deserves to exist; a business plan explains how you will run it day to day. If your feasibility math clears the bar, the natural next document is a full worked plan — our nine-section cafe plan example shows exactly what that looks like with numbers attached.
| Aspect | Feasibility study | Business plan |
|---|---|---|
| Core question | Should this project exist at all? | How will we run it once it does? |
| When written | Before committing money | After the go decision |
| Key numbers | Break-even, payback, sensitivity scenarios | Startup budget, monthly budget, three-year projections |
| Main reader | You — the founder deciding | Banks, investors, partners |
| Typical outcome | Go, revise, or abandon | Funding, alignment, and an operating roadmap |
Notice the order built into the two documents. The feasibility study's power is the option to walk away cheaply: abandoning an idea at the worksheet stage costs an afternoon, while abandoning it after the equipment is installed costs the equipment. The business plan is what you write once the worksheet tells you the corner is worth fighting for.
Want someone to handle this step for you?
If you would rather have an accountant-consultant run the full model — market study, three-scenario sensitivity, and editable Excel tables — Truescho's feasibility study service starts at €99. No honest consultant guarantees profit; the deliverable is a decision you can defend.
Frequently Asked Questions
What is a feasibility study for a small business?
It is the analysis that decides whether an idea deserves to become a business, done on paper before money is committed. It combines market feasibility (is demand real), technical feasibility (what plant and capacity are needed), and financial feasibility (startup costs, operating costs, break-even, payback, and sensitivity scenarios), following the official outline used by university extension services.
How many pages should a small-business feasibility study be?
There is no official page count — the study must be long enough to carry its evidence. A compact study for a single-location microbusiness can hold its own in about 10 pages; a full study with market data and multi-year scenarios typically runs closer to 30. What matters is that every number traces to a quote or a count, not a guess.
How long does a feasibility study for a small business take?
The arithmetic — the four formulas in this article — takes an afternoon once the inputs exist. The inputs are what take time: collecting supplier quotes, counting traffic, and benchmarking competitors realistically eats one to three weeks for a small project, and compressing that research is where homemade studies fail.
What is the break-even point formula?
Break-even units = fixed costs ÷ (price per unit − variable cost per unit). It is the formula published on the U.S. Small Business Administration's official break-even calculator page, and it yields the number of units you must sell each month before any profit exists.
What does the break-even point mean?
It is the exact sales level where total revenue equals total cost: below it the business loses money with every month of operation, above it every additional unit sold adds its contribution margin as profit. Knowing it converts anxiety into a daily target — 834 washes a month, in our car-wash model.
Does a feasibility study guarantee the project will succeed?
No. A feasibility study reduces the risk of predictable failure — bad math, no demand, unpayable cost structures — but markets shift, competitors react, and execution decides the rest. No honest consultant guarantees profit; the study's job is to make the go-or-abandon decision rational instead of emotional.
Sources
- U.S. Small Business Administration — Break-even point calculator (official): https://www.sba.gov/counseling/plan-your-business/break-even-point-calculator/
- U.S. Small Business Administration — Plan your business (startup costs): https://www.sba.gov/counseling/plan-your-business/
- Food and Agriculture Organization of the United Nations — Conducting a feasibility study: https://www.fao.org/4/w6864e/w6864e09.htm
- Iowa State University Extension — Feasibility Study Outline (C5-66): https://www.extension.iastate.edu/agdm/wholefarm/html/c5-66.html
- International Carwash Association — Industry Information: https://www.carwash.org/industry-information
- Monshaat (Saudi Arabia) — official lecture on economic feasibility studies: https://www.youtube.com/watch?v=EZUXWrUGs8U