
A clothing-store owner sits on three years of sales data scattered across Excel files, and if you asked him which branch sells best on Tuesdays, or which size sits longest in the warehouse, he would answer with a feeling, not a number. The gap here is not in the data but in how it is displayed — and that is exactly where a Power BI dashboard comes in: a single page collecting your business indicators into visual panels that speak the moment you look at them. This guide starts with Microsoft's own definition of a dashboard, then puts up the table that settles the most common confusion between Dashboard and Report, then walks through 8 ready examples by industry with each dashboard's KPIs and layout, and closes with the steps to build your first dashboard from an Excel file and design tips for a right-to-left Arabic dashboard.
What Is a Power BI Dashboard? The Official Definition That Clears Confusion
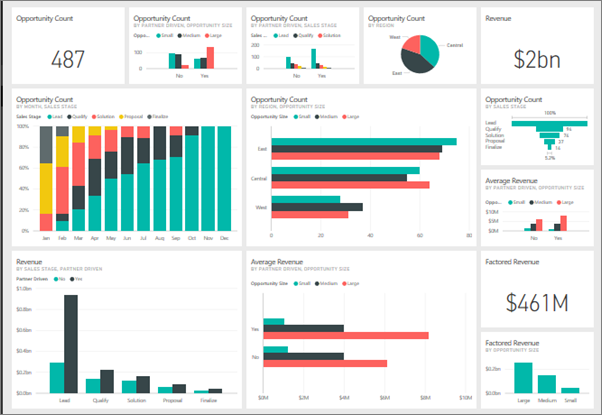
Microsoft defines a dashboard in the Power BI service as "one page, often called a canvas" where you pin tiles from one or more reports or from multiple semantic models. The two key phrases: "one page" and "from multiple sources." A dashboard is not a lengthy report but a fast monitoring screen: selected indicators from different reports gathered in one place, where tiles "update as the underlying data changes," and where you can set alerts on certain tiles to tell you when a number crosses a threshold.
A practical note that saves you an hour of experimentation: dashboards are built inside the Power BI service, not in the Power BI Desktop application — the desktop app is for building reports and models, and you then pin the best visuals as tiles into a service dashboard. To view dashboards in a workspace shared with a team, each user needs a Pro or Premium per-user license, with an explicit exception for your personal "My Workspace." The desktop application itself is entirely free, connects to more than 100 data sources, and ships with more than 30 ready visuals.
Dashboard or Report? The Table That Settles the Decision
The most common beginner question: what is the difference between a dashboard and a report? This table summarizes the differences exactly as Microsoft documents them:
| Comparison point | Dashboard | Report |
|---|---|---|
| Page count | Exactly one page | One or more pages |
| Data source | One or more models (multiple reports and datasets) | A single semantic model per report |
| Where it is built | Power BI service (cloud) | Power BI Desktop or the service |
| Filtering and drilling | No slicer filtering or full interactive navigation | Full filtering, drilling, and cross-highlighting |
| Alerts | Available on specific tiles | Not available |
| Best use | Daily monitoring of live indicators | Deep analysis and exploring causes |
The practical rule extracted from the table: the report is the analysis tool (why did the north branch's sales drop in March?) and the dashboard is the monitoring tool (what are today's indicators versus target?). The mature workflow starts with a well-built report, then pins its summary into a dashboard you open every morning.
Eight Ready Examples by Industry: KPIs and Layout for Each
The real value of examples is not the pictures but knowing "what do I even put on my dashboard?" Here are eight copy-ready content templates, with the top three indicators per sector and a suggested page layout:
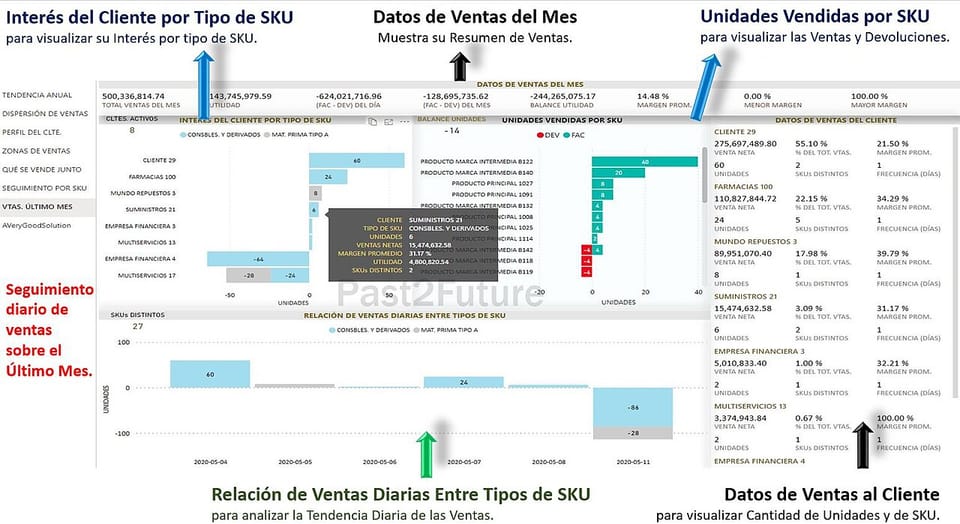
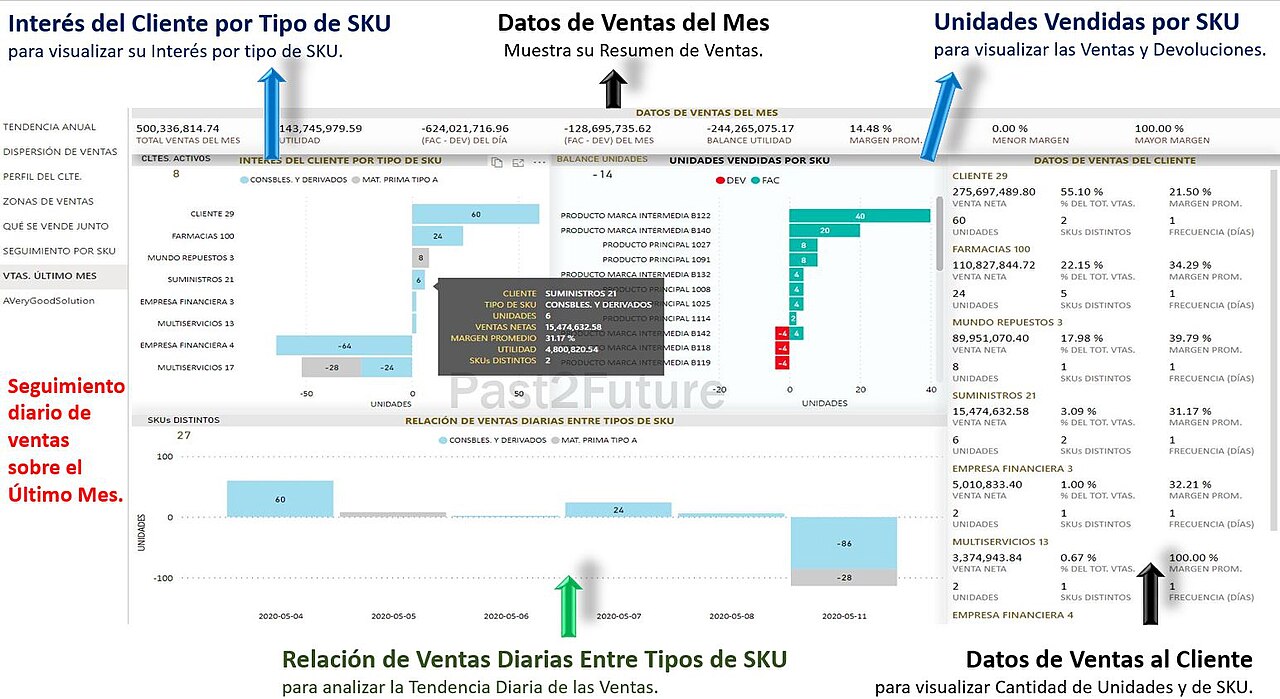
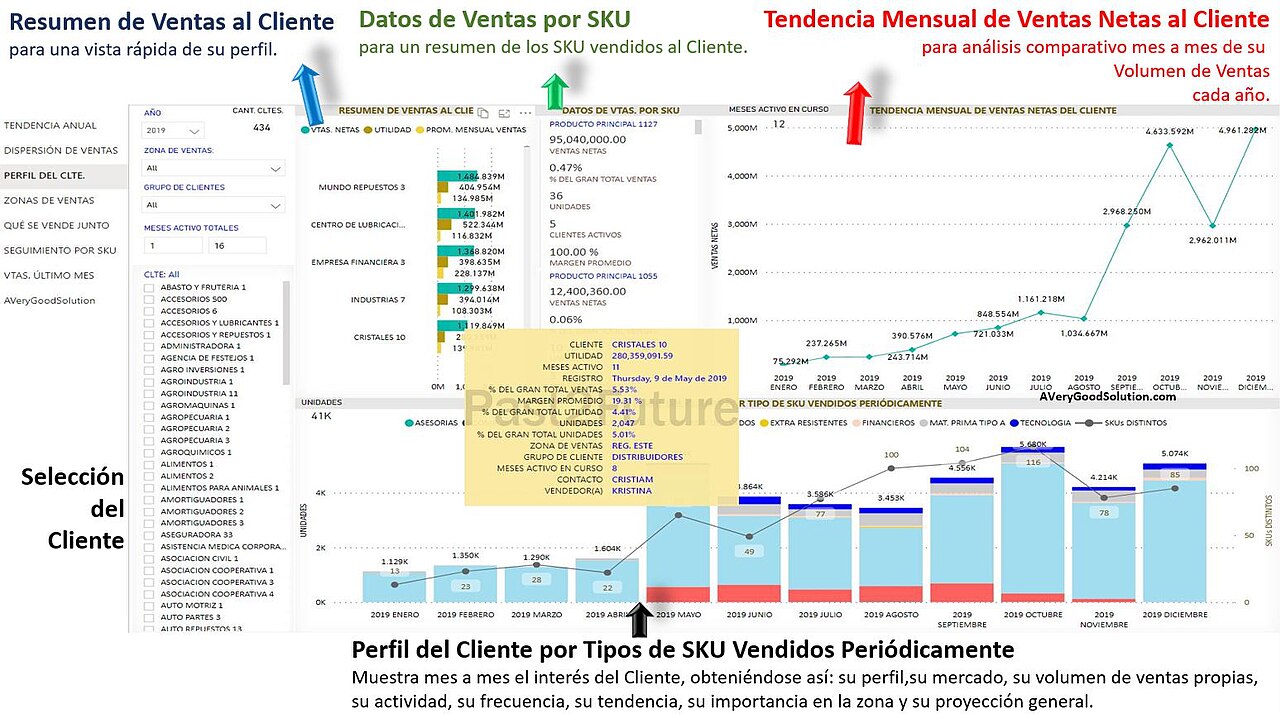
1. Retail sales dashboard. KPIs: today's sales versus target, average basket value, visitor-to-buyer conversion. Layout: a top strip of three big number cards, then a weekly trend line, then a heat map across branches. The real example in the image above shows the idea: a row of numeric indicators on top, product- and customer-level detail below.
2. Finance dashboard. KPIs: monthly cash flow, gross profit margin, average days sales outstanding. Layout: a left column with current-month numbers, a right column comparing month over month, and a waterfall chart explaining the difference. Its ideal source is an organized accounting journal — every indicator derives directly from consistently recorded entries, and any mismatch between dashboard and ledger exposes a flaw in one of them instantly.
3. HR dashboard. KPIs: actual headcount versus plan, employee turnover rate, average accumulated leave days. Layout: indicators on top, distribution by department, then a hiring-and-exits timeline.
4. Inventory dashboard. KPIs: value of dead stock, availability of fast-moving items, inventory turnover. Layout: an item matrix sorted by days of cover, conditional coloring for critical items, and a weekly movement column chart.
5. Marketing dashboard. KPIs: customer acquisition cost, return on ad spend, campaign open rates. Layout: KPI cards on top, channel comparison beside, and a campaign timeline.
6. E-commerce dashboard. KPIs: cart abandonment rate, average order value, top-converting traffic sources. Layout: a conversion funnel in the center, traffic sources on the right, device performance on the left.
7. School dashboard. KPIs: daily attendance rate, students behind on fees, average grades by class. Layout: three top cards, a class/subject matrix, then a monthly attendance line.
8. Clinic dashboard. KPIs: cancelled appointments, average wait time, utilization of doctors or equipment. Layout: today's operational indicators on top, an appointments table by physician, then a weekly appointment timeline.
Notice the common denominator across all eight: only three to five indicators in the top strip, at most two supporting detail visuals, and a single reading direction from most to least important. A dashboard with twenty visuals is not a dashboard but a graveyard of numbers nobody reads.
The practical way to use these templates: do not copy the whole list — pick the sector closest to your business and disable what you have no data for yet. A young online store starts with just the e-commerce trio, adds inventory indicators after its first quarter of real stock, then marketing indicators when ad channels multiply. And remember each indicator needs its definition and source before its visual: decide "average order value = revenue divided by completed orders, from the orders table" before drawing any card. The template is a starting point that saves weeks of thinking from scratch; adapting it to your real data is what makes your dashboard yours.
How to Choose KPIs Before Opening the Tool: The Three-Questions Method
The most common mistake happens before the software opens at all: the owner launches Desktop and starts dropping random visuals hoping the picture clarifies. The correct method is inverted. First write the three questions that scare you about your business this month: "Are our sales keeping pace with the season?", "Will inventory cover upcoming demand?", "Which marketing channel deserves a bigger budget?". Then define for each question the single number that answers it directly — and you have your three core indicators without any ready template. Then add a target line to each indicator so you know whether the number is good or bad — an indicator without a target is a bare number, and comparing only to last month misleads, because seasonality plays its part.
Test your three indicators with this question: if this number moved 20% tomorrow, would I make a different decision? If yes, it is a real indicator that belongs in the top strip; if it is "nice to know," move it to the detail report or delete it. This filter is what separates a dashboard read every morning from one opened once and forgotten — and it is the cheapest improvement available, costing only pen and paper before the build.
The Layout Template That Works for Any Sector
Most successful dashboards — whatever the industry — follow one structure you can summarize in three layers. The top layer (a strip across the page, small height): three to five big number cards, each carrying the indicator, its unit, and its comparison to target in a neutral color or red on deviation. The middle layer (roughly two-thirds of the page): only two detail visuals — a time trend line on the right for right-to-left readers showing the monthly story, and a comparison chart on the left (branches, products, or channels). The bottom layer (a thin strip): a period slicer together with the data's last-refresh date. This structure serves all eight examples above by changing only the indicator names, and its virtue is that it reads in ten seconds: the eye catches the big number, then the trend, then the comparison.
When you build for Arabic, mirror the template horizontally so the card strip starts on the right and everything flows leftward, and keep the period slicer in a fixed spot always — top right, say — so your team learns its location once. And when the dashboard goes to a vertical screen in a hallway or office, stack the same layers vertically: cards on top, trend in the middle, comparison below, because a compressed horizontal layout on a vertical screen becomes unreadable no matter how good its numbers.
Design Mistakes That Destroy a Dashboard's Usefulness
After reviewing dozens of small-business dashboards, the same mistakes repeat tirelessly. First: too many visuals — twenty charts on a page means none gets read; the cure is the decision filter (the 20% question above). Second: pie charts for everything — a circle works for at most four slices; beyond that use columns sorted descending. Third: missing units and targets — "432" alone means nothing; "432K riyals against a 500K target" means everything. Fourth: decorative color gradients on bars — the eye reads differences in length, not in tint, and colors are information, not decoration. Fifth: unformatted dates showing as serial numbers or English formats inside an Arabic dashboard — fix the date format once in the model itself. Sixth, and most dangerous: a dashboard nobody refreshes, showing last quarter's data and losing the whole team's trust; if scheduled refresh is impossible, print the last-updated date in large text and retire the dashboard when it goes stale.
Steps to Build Your First Dashboard from an Excel File
The following official video from the Microsoft Power BI channel walks you through getting started with the desktop app:
Then these are the implementation steps in the order you will actually face them. Step one: download Power BI Desktop free from Microsoft's site, then from "Get data" choose Excel file and select your sales sheet — the app connects to more than 100 sources from files to databases to cloud services. Step two: clean your data in the Power Query editor: correct column headers, data types (dates as dates, numbers as numbers), and remove empty rows and duplicated totals, because every cleaning minute saves an hour of later correction. Step three: build the model and create relationships between tables (sales to products to branches) and define at least one measure in DAX such as total sales or profit margin.
A miniature example makes it concrete: one Excel sheet named "Sales" with only five columns — date, branch, product, quantity, revenue — and another named "Targets" with month and target per branch. After loading and cleaning, relate the tables on the branch column and create two DAX measures: Total Sales as the sum of revenue, and Target Attainment as that measure divided by the summed targets for the selected period. One page with two cards (Sales, Attainment), a monthly trend line, and a branch column chart: a fully functional dashboard for a small business, built in one hour from two simple sheets, and growable later by adding a channel column or a customers table without breaking anything.
Step four: assemble the report page: KPI cards on top, a trend line, a comparison chart, and a period slicer. Step five: press Publish to your workspace in the cloud service, and pin the key visuals into a new dashboard with the pin icon — this is exactly where your reports become a live monitoring dashboard updating with every data refresh. Step six: enable scheduled refresh if your data sits on a cloud source, and share the dashboard with your team through the workspace.
Steps four and five — choosing the indicators and building the DAX model — are the real obstacle for most owners: the tool is free and the tutorials exist, but translating "messy numbers" into "a dashboard that answers management questions" is a practiced craft. That is why Truescho offers a Power BI dashboard design service: a 119-euro plan for up to 3 pages from one data source, and a 219-euro plan for up to 6 pages from two sources with scheduled refresh if you are licensed. Work starts by agreeing the KPIs before any design, includes DAX handling and interactive period/branch/product filters, and delivers a PBIX file with a written walkthrough. The service excludes Pro/Premium licenses, manual data entry, and complex ERP integrations — shared responsibilities worth knowing up front.
Design Tips for a Right-to-Left Arabic Dashboard
An Arabic dashboard has requirements many ready templates ignore. First, direction: make the reading flow right-to-left — the most important indicator sits on the screen's right, not its left — and use visuals that support Arabic text alignment. Second, numerals: keep Western digits (0-9) everywhere in the dashboard, since they read clearest in financial context and stay consistent with exported reports. Third, typeface: choose a clear Arabic face at no less than 12 points for labels, and make the main KPI number the largest element on the entire page. Fourth, color: one brand color with its shades, and reserve red exclusively for negative deviation from target — when the dashboard turns red, everyone must know something deserves attention. Fifth: write the unit beside every number (riyal, dollar, percent, days); a number without a unit is half an answer. Sixth, purely practical: test your dashboard on two screen sizes before adopting it — visuals balanced on a wide monitor can pile up on a small laptop or vertical display, and a card that wraps to two lines loses its headline number. Keep fixed margins between visuals instead of letting them touch; visual breathing room is not waste but what lets each number be read alone.
From Your Books to Your Dashboard: The Natural Path for Numbers
A dashboard is only as strong as what feeds it. The best data source for your shop's indicators is not scattered files but organized ledgers that give you inventory cost, expenses, and balances as they are — exactly what we covered in our small business bookkeeping basics guide; a tidy journal table converts directly into a clean data model with no middlemen. Likewise, if you have a business plan with annual targets — like the one we built in the ready small business plan example — carry those targets into a target line above your trend chart, and your dashboard becomes a live performance measurement against the plan rather than a rearview display of past numbers.
Maintenance: How Your Dashboard Stays Alive After the First Week Fades
Dashboards do not die from bad design but from abandonment. Three simple practices keep them alive. First: one known owner — a single person responsible for refreshes working and numbers making sense, because collective ownership of a dashboard means, in practice, no ownership. Second: a monthly review of the indicator list itself: ask your team what decision last month was made because of the dashboard; if the answer is blank, the indicators need replacing with today's more urgent questions, because questions change with business stages and a good dashboard changes with them. Third: document each indicator's definition in a small note on the page (what exactly does the number compute, from where?) — the most common management argument is not about the number but its definition: "monthly sales" before or after returns? By invoice date or collection date? A documented definition inside the dashboard ends the argument before it starts.
Practically, dedicate half an hour monthly to dashboard maintenance: verify the scheduled refresh has not broken, that the latest data date matches expectations, and that no visual broke after a source-file change (a deleted column or renamed sheet is the most common silent model breaker). That half hour is the difference between a tool used for a full year and digital decoration opened only in meetings.
Want Someone to Handle This Step for You?
If the eight layouts above are clear but building them yourself needs time you do not have, the step can be delegated as described in the Power BI design service — and if the interface itself, the look of the screens and the experience of whoever uses them, is what concerns you, Truescho also offers a UI/UX design service at 129 euros for up to 5 screens and 269 euros for up to 12 screens with a clickable prototype and a mini design system, delivered in Figma in Arabic or English with two revision rounds. You submit a request, agree on the indicators and screens, and receive a dashboard ready to show your team or your investors with confidence.
Frequently Asked Questions
What is the difference between a Power BI dashboard and a report in one line?
A dashboard is a single monitoring page collecting tiles from multiple reports and models, supports alerts, and does not support interactive filtering. A report has multiple pages, is built on a single data model, and gives you full filtering and drilling to analyze causes. The rule: the dashboard answers "how are we now?" and the report answers "why did this happen?".
Is Power BI really free, and do I need a license?
The Power BI Desktop application is completely free for individual use: building models and reports and connecting to more than 100 sources. Paid licenses (Pro and Premium) come into play when sharing content in a workspace with a team or viewing others' dashboards, with an exception for your personal workspace. Start free alone; pay when you truly need sharing.
Can I build the dashboard from an Excel file only?
Yes, and it is the single most common starting scenario. From Get data choose the Excel file, organize your data into named tables with consistent rows, clean it in Power Query, then build the model and visuals. The only constraint: each report draws on one model, so if your numbers live in separate files, merge them in the model or use several reports and pin their tiles into one dashboard.
What colors and numerals work best for an Arabic dashboard?
Use one main color with its shades over white, and reserve red solely for negative deviation. Set the direction right-to-left so the most important indicator sits on the right, use Western digits 0 through 9 throughout, write the unit beside every number, and make the main KPI the largest text on screen so it reads from two steps away.
How many indicators should one dashboard carry?
Three to five in the top strip, with two supporting detail visuals. A dashboard is for fast monitoring, not a full report: if you need to scroll to see everything, you are building a multi-page report, not a dashboard. Extra indicators clutter, slow reading, and bury the important number among the ordinary.
How does dashboard data refresh automatically?
Tiles in a dashboard update automatically as the underlying data changes when the model refreshes in the service. For automation, enable scheduled refresh from the cloud model's settings (generally requiring cloud sources or a gateway) and pick a sensible frequency: hourly for live daily operations, and twice daily is enough for most small businesses.
Does Power BI suit a very small business?
Yes, if you have recurring data worth watching. The app is free and the greater effort is organizing the data, not the tool. A single-branch store needs a simple sales and inventory dashboard buildable in days, and it grows along: the same file later absorbs branches and sales channels without rebuilding. If your data is not recurring yet, start by organizing its source before thinking about a dashboard.
Can I display the dashboard on a screen inside the shop?
Yes. Publish the dashboard to the web or open the Power BI app on a device attached to the screen, and it will display the indicators per the scheduled refresh. For a clean display use the service's full-screen mode, make sure fonts are large enough for viewing distance, and check that the screen's orientation — portrait or landscape — matches the dashboard layout.
Sources
- Microsoft Learn — Introduction to dashboards for Power BI designers (one-page canvas definition, tiles, updating, alerts): https://learn.microsoft.com/en-us/power-bi/create-reports/service-dashboards
- Microsoft Learn — Dashboards in Power BI service vs. Power BI Desktop: https://learn.microsoft.com/en-us/power-bi/create-reports/service-dashboards-designers
- Microsoft Learn — What is Power BI? (overall model, data sources, Power Query, DAX): https://learn.microsoft.com/en-us/power-bi/fundamentals/desktop-what-is-desktop
- Truescho — Small business bookkeeping basics (a clean data source for your dashboard): https://blogs.truescho.com/small-business-bookkeeping-basics-ar/
- Truescho — Small business plan example (plan targets as a target line): https://blogs.truescho.com/small-business-plan-example-ar/